Creating AWS CloudWatch Dashboards and Alarms with CDK
Monitoring is a crucial part of software operations, but can also be one of the most tedious to implement. If you’re using a traditional config-based IAC tool such as CloudFormation, SAM, Serverless, Terraform, et al. you’ll find yourself copy-pasting dozens of lines for each new metric that you want to graph and alert on.
Modern IAC tools such as CDK enable you to define your infrastructure using actual code (often TypeScript) rather than config (JSON, YAML). I like to refer to these two approaches to IAC as IACode and IAConfig respecively.
In this article we’ll cover how to build a CloudWatch Dashboard and Alarms to monitor a Full Stack Serverless AWS application consisting of API Gateway, Lambda, Cognito, DynamoDB, and a web app hosted on Amplify Hosting. Here’s what the end result looks like (though you’ll need to use your imagination to fill in the empty charts with pretty lines).
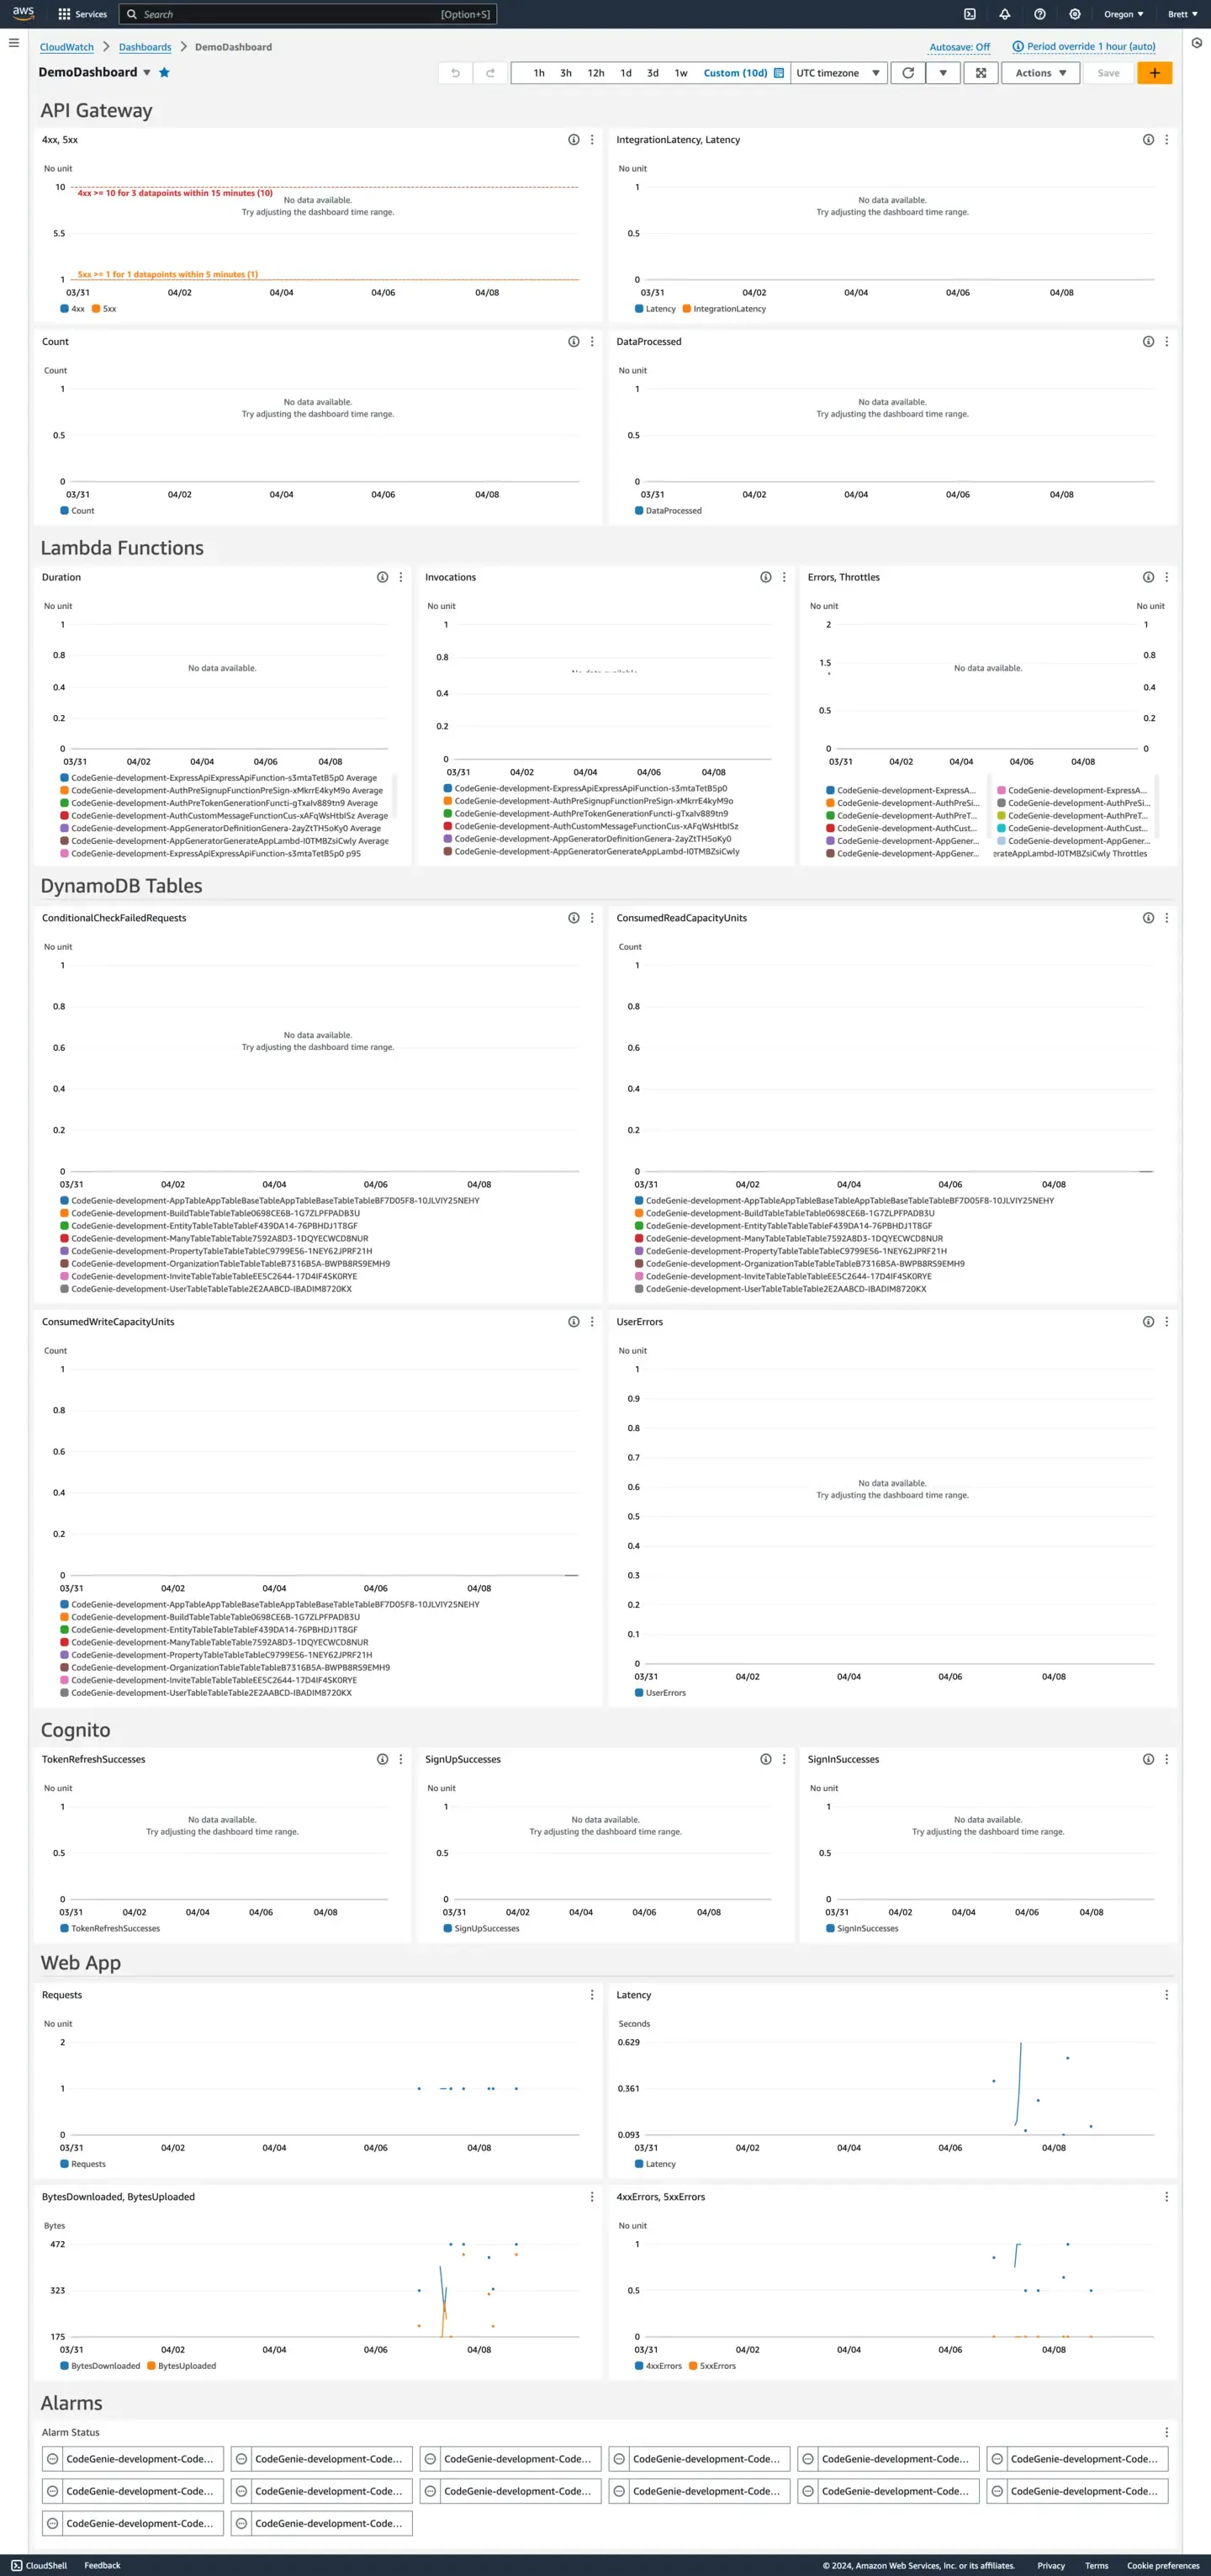
Example dashboard that would look so much more interesting if it had actual data.
Monitoring Construct
Enough preamble. Let’s get into the code! We’ll start by creating a Monitoring construct that allows us to encapsulate all of the relevant infrastructure in a single place.
import { Construct } from 'constructs'import {  Alarm,  AlarmRule,  AlarmState,  AlarmStatusWidget,  CompositeAlarm,  Dashboard,  GraphWidget,  Metric,  TextWidget,  TextWidgetBackground,} from 'aws-cdk-lib/aws-cloudwatch'import { IFunction } from 'aws-cdk-lib/aws-lambda'import { IHttpApi } from 'aws-cdk-lib/aws-apigatewayv2'import { IApp } from '@aws-cdk/aws-amplify-alpha'import { ITableV2 } from 'aws-cdk-lib/aws-dynamodb'import { Topic } from 'aws-cdk-lib/aws-sns'import { EmailSubscription } from 'aws-cdk-lib/aws-sns-subscriptions'import { SnsAction } from 'aws-cdk-lib/aws-cloudwatch-actions'
interface MonitoringProps {  amplifyApp: IApp  api: IHttpApi  userPoolId: string  userPoolClientId: string  functions: Array<IFunction>  tables: Array<ITableV2>}
const ALARM_NOTIFICATION_EMAIL = 'you@example.com'
export default class Monitoring extends Construct {  public readonly dashboard: Dashboard  public readonly alarmSnsTopic: Topic  constructor(scope: Construct, id: string, props: MonitoringProps) {    super(scope, id)    this.alarmSnsTopic = new Topic(scope, 'AlarmTopic')    this.alarmSnsTopic.addSubscription(new EmailSubscription(ALARM_NOTIFICATION_EMAIL))    this.dashboard = new Dashboard(this, 'Dashboard', {      start: '-P10D',    })
    const { alarms: apiAlarms } = this.addApiWidgets({ api: props.api })    const { alarms: lambdaAlarms } = this.addLambdaWidgets({ functions: props.functions })    this.addTableWidgets({ tables: props.tables })    this.addCognitoWidgets({ userPoolId: props.userPoolId, userPoolClientId: props.userPoolClientId })    this.addWebAppWidgets({ amplifyApp: props.amplifyApp })    this.addAlarmStatusWidget({ alarms: [...apiAlarms, ...lambdaAlarms] })  }
  addHeading(heading: string) {    this.dashboard.addWidgets(      new TextWidget({        markdown: `# ${heading}`,        width: 24,        height: 1,        background: TextWidgetBackground.TRANSPARENT,      })    )  }
  subscribeAlarm(alarm: Alarm | CompositeAlarm) {    alarm.addAlarmAction(new SnsAction(this.alarmSnsTopic))  }  /*  ...  */}
The Monitoring construct class accepts details on other resources within our app such as our Amplify Hosting App, API Gateway, Cognito User Pool and Client, and a list of Lambda Functions and DynamoDB Tables that we want to monitor.
The constructor creates an SNS Topic that’s set up to send an email whenever it receives a message (i.e whenever an alarm is triggered). Make sure you replace ALARM_NOTIFICATION_EMAIL with the email address you want to receive notifications.
We’re also creating the CloudWatch Dashboard resource and calling methods to add widgets and alarms (we’ll get to the implementation of these next).
Finally, we have some helper methods for adding headings to our Dashboard and subscribing alarms to our SNS Topic.
Next we’ll get into creating metrics, alarms, and dashboard widgets for our API Gateway resource.
API Gateway Metrics, Alarms and Dashboard Widgets
addApiWidgets({ api }: { api: IHttpApi }) {  this.addHeading('API Gateway')  const clientErrorsMetric = api.metricClientError()  const serverErrorsMetric = api.metricServerError()  const clientErrorsAlarm = clientErrorsMetric.createAlarm(this, 'ApiClientErrorsAlarm', {    evaluationPeriods: 3,    threshold: 10,  })  this.subscribeAlarm(clientErrorsAlarm)  const serverErrorsAlarm = serverErrorsMetric.createAlarm(this, 'ApiServerErrorsAlarm', {    evaluationPeriods: 1,    threshold: 1,  })  this.subscribeAlarm(serverErrorsAlarm)
  this.dashboard.addWidgets(    new GraphWidget({      width: 12,      left: [        clientErrorsMetric,        serverErrorsMetric,      ],      leftAnnotations: [        clientErrorsAlarm.toAnnotation(),        serverErrorsAlarm.toAnnotation(),      ],    }),    new GraphWidget({      width: 12,      left: [        api.metricLatency(),        api.metricIntegrationLatency(),      ],    }),    new GraphWidget({      width: 12,      left: [        api.metricCount(),      ],    }),    new GraphWidget({      width: 12,      left: [        api.metricDataProcessed(),      ],    }),  )
  return {    alarms: [serverErrorsAlarm, clientErrorsAlarm],  }}
Many CDK Constructs come with helper metric* methods that return metrics for the most popular standard metrics of each AWS service. In API Gateway’s case, all of the standard metrics we’re interested in have these helper metrics. Thank you CDK Team! 🙏
We create alarms for both Client Errors and Server Errors. The thresholds are low and you should tweak them to meet your needs (maybe you don’t want to alarm on Client Errors at all since they’re often not actionable). We also add these error metrics to our dashboard and add “red lines” (horizontal annotations) so that we can see how close we get to breaching our alarms. Once again, the CDK Team shows great attention to detail by including a toAnnotation() method on their alarms to make this super easy! 🙌
We also add metrics for latency (consider adding alarms for this), number of requests, and amount of data processed.
Let’s move onto Lambda.
Lambda Metrics, Alarms and Dashboard Widgets
The main difference with the Lambda metrics is that we’re dealing with multiple Lambda Functions (as opposed to a single API Gateway Resource). Each graph includes the metrics for all of the Lambda Functions passed into the Monitoring construct.
addLambdaWidgets({ functions }: { functions: Array<IFunction> }) {  this.addHeading('Lambda Functions')  const errorMetrics = functions.map(fn => ({ fn, metric: fn.metricErrors()}))  const throttleMetrics = functions.map(fn => ({ fn, metric: fn.metricThrottles()}))  const errorAlarms = errorMetrics.map(errorMetric => errorMetric.metric.createAlarm(this, `ErrorAlarm${errorMetric.fn.node.id}`, {    evaluationPeriods: 1,    threshold: 1,  }))  const throttleAlarms = throttleMetrics.map(throttleMetric => throttleMetric.metric.createAlarm(this, `ThrottleAlarm${throttleMetric.fn.node.id}`, {    evaluationPeriods: 1,    threshold: 1,  }))  const errorCompositeAlarm = new CompositeAlarm(this, 'ErrorCompositeAlarm', {    alarmRule: AlarmRule.anyOf(      ...errorAlarms.map(errorAlarm => AlarmRule.fromAlarm(errorAlarm, AlarmState.ALARM)),      ...throttleAlarms.map(throttleAlarm => AlarmRule.fromAlarm(throttleAlarm, AlarmState.ALARM)),    ),  })  this.subscribeAlarm(errorCompositeAlarm)  this.dashboard.addWidgets(    new GraphWidget({      width: 8,      left: [        // Alternatively, you could use `functions.map` to instead create one GraphWidget per function.        ...functions.map(fn => fn.metricDuration()),        ...functions.map(fn => fn.metricDuration({          statistic: 'P95',        })),      ],    }),    new GraphWidget({      width: 8,      left: functions.map(fn => fn.metricInvocations()),    }),    new GraphWidget({      width: 8,      left: errorMetrics.map(m => m.metric),      right: throttleMetrics.map(m => m.metric),      leftAnnotations: [errorAlarms[0].toAnnotation()],    }),  )
  return {    alarms: [...errorAlarms, ...throttleAlarms],  }}
The metrics we’re graphing are duration (both average and P95), number of invocations, number of errors, and number of times a function was throttled. We’re only alarming on the error and throttle metrics here, though you should also consider alarming on duration.
We’re creating 2 alarms per Lambda Function for throttle and error. These alarms aren’t set up to notify. Instead, we create a composite alarm so that we don’t get inundated with notifications when a single issue causes multiple functions to fail.
See the Lambda Metrics Documentation for other available standard metrics.
DynamoDB Metrics and Dashboard Widgets
There’s nothing new to learn here that isn’t covered by the Lambda section. For each DynamoDB Table provided we’re graphing the number of consumed Read and Write Capacity Units, and the number of User Errors.
addTableWidgets({ tables }: { tables: Array<ITableV2> }) { this.addHeading('DynamoDB Tables') this.dashboard.addWidgets( new GraphWidget({ width: 8, left: tables.map(table => table.metricConsumedReadCapacityUnits()), }), new GraphWidget({ width: 8, left: tables.map(table => table.metricConsumedWriteCapacityUnits()), }), new GraphWidget({ width: 8, left: tables.map(table => table.metricUserErrors()), }), )}Consider adding an alarm for the UserErrors metric since it’s likely due to a bug in your code. If you’re not using DynamoDB’s On Demand billing, you should also consider adding alarms for RCUs and WCUs.
DynamoDB offers significantly more standard metrics than most AWS Services, so you should definitely familiarize yourself with them and decide what’s important for you to graph and alarm on. But don’t go overboard! It’s important to find the right balance between alarming on too many things and not enough.
See the DynamoDB Metrics Documentation for other available standard metrics.
Cognito Metrics and Dashboard Widgets
Adding Cognito User Pools graphs gives great insights on the number of new and returning users. You may even be able to use the TokenRefreshSuccesses metric to get a rough number of currently active users.
addCognitoWidgets({ userPoolId, userPoolClientId }: { userPoolId: string, userPoolClientId: string }) { this.addHeading('Cognito') const dimensionsMap = { UserPool: userPoolId, UserPoolClient: userPoolClientId, } this.dashboard.addWidgets( new GraphWidget({ width: 8, left: [new Metric({ namespace: 'AWS/Cognito', metricName: 'TokenRefreshSuccesses', dimensionsMap, })], }), new GraphWidget({ width: 8, left: [new Metric({ namespace: 'AWS/Cognito', metricName: 'SignUpSuccesses', dimensionsMap, })], }), new GraphWidget({ width: 8, left: [ new Metric({ namespace: 'AWS/Cognito', metricName: 'SignInSuccesses', dimensionsMap, }), new Metric({ namespace: 'AWS/Cognito', metricName: 'FederationSuccesses', dimensionsMap, }), ], }), )}Unfortunately, the Cognito User Pool Construct doesn’t have those handy metric* methods, so we need to manually create them using new Metric.
See the Cognito Metrics Documentation for other available standard metrics.
Amplify Hosting Metrics and Dashboard Widgets
I’ve encountered way too many people that don’t know about Amplify Hosting. If you need to host a web app on AWS: I highly recommend Amplify Hosting over the more traditional approach of S3 + CloudFront.
addWebAppWidgets({ amplifyApp }: { amplifyApp: IApp }) { this.addHeading('Web App') const dimensionsMap = { App: amplifyApp.appId, } this.dashboard.addWidgets( new GraphWidget({ width: 12, left: [new Metric({ namespace: 'AWS/AmplifyHosting', metricName: 'Requests', dimensionsMap, })], }), new GraphWidget({ width: 12, left: [new Metric({ namespace: 'AWS/AmplifyHosting', metricName: 'Latency', dimensionsMap, })], }), new GraphWidget({ width: 12, left: [new Metric({ namespace: 'AWS/AmplifyHosting', metricName: 'BytesDownloaded', dimensionsMap, }), new Metric({ namespace: 'AWS/AmplifyHosting', metricName: 'BytesUploaded', dimensionsMap, })], }), new GraphWidget({ width: 12, left: [ new Metric({ namespace: 'AWS/AmplifyHosting', metricName: '4xxErrors', dimensionsMap, }), new Metric({ namespace: 'AWS/AmplifyHosting', metricName: '5xxErrors', dimensionsMap, }), ], }), )}Alarm Status Dashboard Widget
Finally we’ll display a list of our alarms and their current status.
addAlarmStatusWidget({ alarms }: { alarms: Array<Alarm> }) { this.addHeading('Alarms') const alarmStatusWidgetHeight = 1 + Math.ceil(alarms.length / 6) this.dashboard.addWidgets(new AlarmStatusWidget({ alarms, width: 24, height: alarmStatusWidgetHeight, }))}You should also check out the other CDK CloudWatch Dashboard Widgets. The LogQueryWidget is especially useful for adding a quickview of logs that can be filtered using query insights (e.g. you can display the latest error logs).
Using the Construct
Now that we’ve created the Monitoring construct, we can add it to our CDK stack by instantiating an instance and passing in details about our full stack application.
new Monitoring(this, 'Monitoring', { userPoolId: userPool.userPoolId, userPoolClientId: userPoolClient.userPoolClientId, amplifyApp: amplifyApp, api: api, functions: [lambdaFunction1, lambdaFunction2], tables: [dynamoDbTable1, dynamoDbTable2],})A note on laying out widgets
CloudWatch Dashboards are rendered as a 24 column layout. Keep this in mind when deciding on the width of each widget.
According to the docs, every widget included in a single addWidgets is rendered next to each other, and every new call to addWidgets creates a new row. In practice, I found that when my widgets within a single addWidgets didn’t add up to a multiple of 24, the layout started to go a little wonky, and widgets that I expected to be rendered in a new row (because they were in a separate addWidgets) were not.
There are Row and Column constructs that can also give you more control over layout.
Custom Metrics
Graphing and alarming on the standard metrics that AWS provides us with out-of-the-box is only half the story. To improve your “operational excellence” you’ll want to add Custom Metrics relevant to your business requirements.
Try it yourself with Code Genie
Building a full stack Serverless app on AWS takes a lot of time, effort, and expertise. Code Genie lets you get up and running fast with a solid software foundation based on your data model. In minutes you can have a full stack application deployed to your own AWS account, and the source code downloaded for you to start hacking. Metrics, Monitoring, and a Dashboard like the one described in this article is included out-of-the-box. Check out the Getting Started Guide for more details.